Website: Climate Hot Map - Union of Concerned Scientists
Initial Publication Date: April 29, 2016
Summary
×
![[creative commons]](/images/creativecommons_16.png)
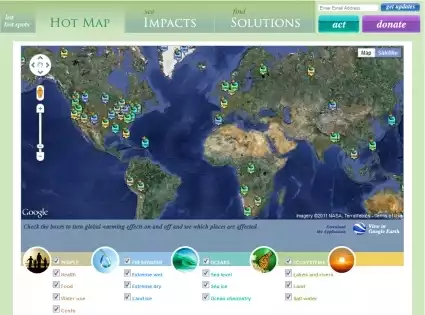
Explore the signs of global warming on this map or Google Earth. The evidence of climate change includes heat waves, sea-level rise, flooding, melting glaciers, earlier spring arrival, coral reef bleaching, and the spread of disease. Scientists project that unless emissions of heat-trapping gases are brought under control, the impacts of climate change are likely to increase.
Learning Goals
To increase awareness of the impact of climate change around the world and learn of possible solutions as well as offer solutions.
Context for Use
The greatest concentration of global warming indicators on the map is in North America and Europe because that is where most scientific investigation has been done to date. As scientists focus increasingly on fingerprints of global warming in other regions—from Russia to Antarctica and Oceania to South America—the evidence they find will be added to the map.
Description and Teaching Materials
Teaching Notes and Tips
This interactive map can be used in many ways to enhance learning and encourage active participation in the campaign to combat catastrophic impacts from climate change.
Assessment
Assessment to be at the discretion of the educator.
References and Resources

×
![[reuse info]](/images/information_16.png)