Module/Unit: Linking Climate Change to the Energy Economy
Summary
![[creative commons]](/images/creativecommons_16.png)
Students quickly learn that climate change is linked to energy, because the major source of emissions of carbon dioxide comes from burning fossil fuels. Students must gain, however, a more detailed understanding of the energy economy in order to grapple with both the scientific and political economic challenges of changing current patterns of energy use.
This exercise provides a framework for understanding the profile of energy use patterns in the United States. It also provides an easily understood, simple calculation of the magnitude of the challenge facing those who seek to reduce carbon dioxide emissions from burning fossil fuels. The reason nuclear power often emerges as a proposed solution to reducing carbon dioxide emissions also becomes clear. The exercise does not by itself take students to analyzing whether nuclear power or any other alternative fuel is a good solution for climate change (that is a task for other exercises), but the framework provided is essential for future work on reforming the energy economy.
Learning Goals
Context for Use
Understanding the links between climate change and energy involves knowing the energy profile or "energy economy" of a country or region, especially advanced, industrialized areas. These countries or regions derive energy from multiple sources of fuels and produce multiple kinds of services from energy. Many discussions of climate change and energy focus on one-fuel-or-use-at-a-time, but analyzing the prospects for changing energy supplies or uses requires the concept of energy economy in a region or country. This exercise will help students understand the types of problems associated with the uses of energy and associated efforts to reduce emissions of greenhouse gases.
This exercise is best for upper-division or master's students in environmental studies and sciences (ESS) and other fields. It can also be used with lower division students, but the time and background required to make it comprehensible will be longer. It can be used in classes of any size, although it will work best in classes of fewer than 30 students.
The exercise involves instructor explanation followed by workshop discussions among groups of 2 – 4 students. The material is best utilized as an introduction to climate change and energy issues and problems, but it could be used as a summative exercise. Students in both the natural and social sciences can understand the exercise without specialized courses, but students will benefit from understanding the physical concept of energy, its measurement in units of heat, and the expression of large numbers with powers of 10.
Description and Teaching Materials
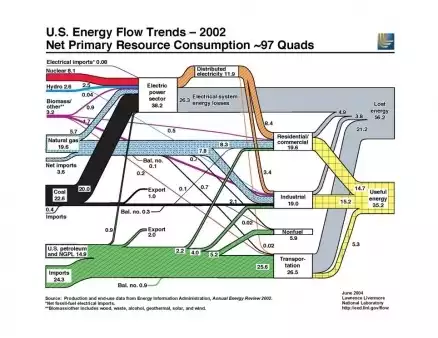
The exercise hinges on a careful examination of an energy flow chart, e.g. as prepared by Lawrence Livermore National Laboratory (Figure 1). The instructor explains the chart's features (see Teaching Notes) and then asks students to work in small groups to formulate answers to questions in "Dissecting the chart on US Energy Flow Trends—2002," (Table 1).
Figure 1. Energy flow chart for the US in 2002 (in quads)
Download larger Image of Figure 1: Energy flow chart for the US in 2002 (in quads)
Table 1. Dissecting the chart on US Energy Flow Trends—2002
The current energy flow is a snapshot at one instant of what the American energy economy was at the time. Use your copy of the chart and work with two or three others to answer the following questions.
- From the chart, what was the overall quantity of energy consumed in the US in 2002?
- Can you reproduce the sum "~97 Quads" by adding up either supplies (on the left) or uses (on the right)? Explain.
- Now look at the right hand side. How many Quads resulted in useful work? How many Quads showed up as "lost energy?" Of the ~97 Quads consumed in the US, what percent was useful work? And what percent was lost as heat?
- List 3 – 5 energy services you enjoy in each of the categories (residential/commercial, industrial, transportation).
- What are the top two energy sources for the US energy economy? What percent of the total do these two fuels provide? Are you surprised? Explain.
- What two sources of energy (left side of chart) are "renewable?" How many Quads come from each source? What percent of the total are provided by these two? Are you surprised? Explain.
- What is nuclear energy used for? What percent of the total US energy comes from nuclear? Are you surprised? Explain.
- How much natural gas goes for transportation? What do you suppose it is transporting?
- Look at the petroleum used for non-fuel purposes. What do you think this use represents? Do you enjoy any benefits from this sector of the economy?
- If the US reduced coal consumption by 80 percent, how many quads of energy would be lost? Do the same calculation for gas and petroleum.
- If 80 percent of coal were not used, what industrial process would be most severely affected? Answer the same question for gas and oil.
- If coal, oil, and gas were each reduced by 80 percent, would the impacts fall equally across the Nation, or would different regions be affected differently? If you don't have enough information to answer the question, what else do you need to know?
- Find something you think is interesting in the chart and be prepared to explain what it is and why it's interesting.
Teaching Notes and Tips
The exercise hinges on a careful examination of an energy flow chart, e.g. as prepared by Lawrence Livermore National Laboratory (Figure 1). The instructor explains the chart's features (see Teaching Notes) and then asks students to work in small groups to formulate answers to questions in "Dissecting the chart on US Energy Flow Trends—2002," (Table 1). Figure 1. Energy flow chart for the US in 2002 (in quads)
1. The first item to explain on the chart is the fact that in 2002 the US commercial energy economy was based on consuming 97 quads or 97 x 1015 British thermal units (Btu). This is a big number (almost beyond comprehension) in a unit familiar only to students of physics. It can be understood by an analogy to a bank account: the US drew upon 97 quads in 2002, like a student might draw upon $97 from his/her bank account. Just as with dollars, an individual can't consume more quads than produced or imported. Quads are units best suited to energy figures for nation-states. You can substitute flow charts from later years to have more up-to-date data.
2. The quad based on Btu's is used as a common measure of heat obtainable from various sources. Expression of energy content in Btu avoids trying to compare different sources in different units, e.g. petroleum in tons of oil equivalent, gas in therms, electricity in kilowatt hours, and so forth. Explain to students that they will see many units of energy used, but they can all be interconverted. Use of one unit, the quad, enables easier comparison of quantities of energy used.
3. The chart is best seen divided into 3 parts: on the left are the specific fuels that provide the heat or its conversion to motion or electricity. In the center of the chart are conversions, e.g. conversions of heat from burning coal or gas to electricity, and routings of fuels to different parts of the economy. On the right are the sectors of the economy making use of the heat or its transformation to electricity or motion. Statistics gathered by the Energy Information Administration divide the US economy into residential/commercial, industrial, and transportation. It's important to have students unpack these large categories into recognizable terms, e.g. a house, grocery store, automobile manufacturing plant, brewery, university, automobile, airplane, and so forth.
4. On the right side also one can see the amount of quads doing useful work and the amount lost as unused heat. The instructor can explain the lost heat in terms of thermodynamic constraints on amount of useful work extractable from a heat source and in terms of inefficiencies of transforming machines. This is a good place to emphasize the importance of increasing efficiency if the number of quads required is to be reduced, e.g. by switching compact fluorescents or LED's for incandescent bulbs, by improving the fuel efficiency of automobiles, by improving the energy efficiency of buildings, and so forth.
5. The energy flow chart is an excellent tool for linking energy to climate change. Carbon dioxide is the most important of the greenhouse gases, and it is impossible to burn fossil fuels without producing it. If CO2can't be captured or stored, then fossil fuel consumption must be reduced in order to reduce CO2emissions. Many targets for reducing CO2 emissions call for 80% reductions, and Table 2 suggests why this is a formidable challenge if accustomed energy services are to continue at rates wealthy nations currently enjoy. If each fossil fuel were reduced 80 percent (assumes no carbon capture and storage), then in 2007 (so far the peak year for energy use in the US), then the US would not have about 70 quads of energy (101.4 – 32.4 = 69). (This is a highly simplistic portrayal of the challenges posed by climate change, but it easily suggests the order of magnitude of the tasks ahead in the context of the overall energy economy. Coal produces more CO2/Btu than petroleum, and petroleum more than gas. Thus a more complex analysis would involve reducing coal and oil more than gas and thus less reduction of quads lost. At the beginning, however, this sort of thinking is more complex than needed. A reduction of 80 percent in each fuel helps show the order of magnitude of the impacts. This analysis also helps students see that simple solutions like "I'll just use biodiesel and a wind turbine" aren't likely to have much positive impact.)
Table 2. Quads remaining in US energy economy after loss of 80 percent of each fossil fuel
|
SOURCE |
CURRENT (Quads, 2007) |
80 % LESS CARBON (Quads) |
|
Fossil fuels |
86.2 |
17.2 |
|
Nuclear |
8.4 |
8.4 |
|
Renewable |
6.8 |
6.8 |
|
TOTAL |
101.4 |
32.4 |
6. A final question can be raised from Figure 1 and Table 2: If other fuels are to replace fossil fuels (after maximizing gains in efficiency), then what fuels might be used? Nuclear power is the fourth largest source of heat (Btu's) in the US economy, larger than the renewable sources, especially wind and solar. Does this automatically mean that nuclear power is the solution to protecting climate from greenhouse gases? No, but off-the-cuff opinions on this question will vary widely (among both instructors and students!). The energy flow chart (Figure 1) and Table 2 help focus attention on why nuclear, as the fourth largest source of heat in the US, occupies a pivotal position in the energy-climate change debate. Understanding the complexities of that debate requires an analysis in which all energy sources can be examined within a common framework. Additional work is needed to assess the relative strengths and weaknesses of all alternatives to fossil fuels.
Click here for a PDF of: Linking Climate Change to the Energy Economy
Assessment
Assessment for this exercise is likely to vary widely depending upon the type of course in which it is embedded. At a minimum, however, at the end a student should be able to provide coherent definitions or discussions of the following terms:
1. Energy flow
2. Quad
3. Energy supply
4. Energy service
5. Useful work
6. Heat lost and not used for useful work
7. Predominant uses of specific fuels (e.g. nuclear for electricity, petroleum for transport, coal for electricity, and so forth)
8. Why nuclear power occupies a pivotal role in debates about solutions to climate change (Note: this is not a question about whether nuclear power is or is not a good solution to climate change; that's an entirely different question that requires an analysis of the strengths and weaknesses of nuclear power compared to the strengths and weaknesses of other non-fossil fuel alternatives)
References and Resources
The Global Climate and Energy Project at Stanford University has prepared more thorough and more complex charts of energy flow for the globe, available at http://gcep.stanford.edu/research/exergycharts.html. For their first exposure to the notion of energy flows, however, the charts prepared by Lawrence Livermore National Laboratory, (e.g. Figure 1) are better. As students advance, the Stanford charts may become useful for some. Lawrence Livermore National Laboratory charts are available at https://flowcharts.llnl.gov/archive.html#energy_archive.
The 2002 chart (Figure 1) is valuable because it shows imports but consolidates the renewable into "Hydro" and "Biomass/other." Versions in 2003 – 2009 drop the imports (not good) but disaggregate renewable fuels into solar, hydro, wind, geothermal, and biomass (good). The later charts also have a large "box" on the left side of the graph with the name of the fuel and the quads it provides that is wider than the line representing the amount of quads provided; this larger box can be misread as suggesting a larger amount of quads provided than is actually the case.
Lawrence Livermore National Lab charts also come in exajoules for 1999 – 2002. Additional charts from Lawrence Livermore National Laboratory depict emissions of carbon dioxide from use of fossil fuels. The Laboratory has also produced energy flow charts for California and flow charts for water resources.
The US Department of Energy, Energy Information Administration, provides an Annual Energy Review with the basic statistics used for US energy flow charts. EIA also has a simplified flow chart at http://www.eia.doe.gov/aer/diagram1.html, but this chart consolidates much information that is disaggregated in the Lawrence Livermore National Laboratory's charts. UK uses tones of oil equivalent as its units rather than quads of exajoules.
Citation
(2011). Module/Unit: Linking Climate Change to the Energy Economy.
CREDIT
I'm indebted to my colleague Rob Knapp at The Evergreen State College, Olympia, WA, for introducing me to "spaghetti charts," as energy flow charts are sometimes called. Any mistakes, however, remain entirely my responsibility.