
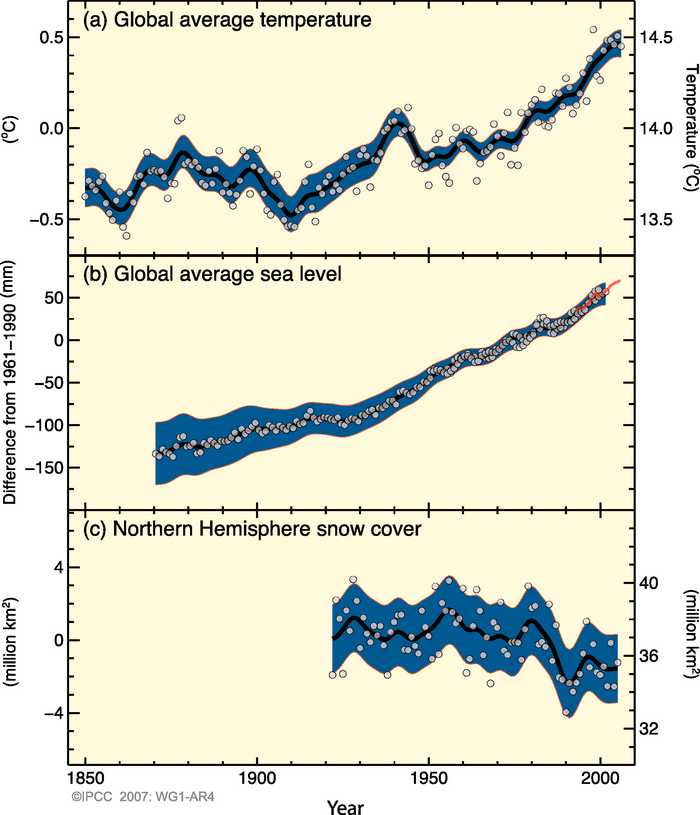
Figure 1. Changes in temperature, sea level, and Northern Hemisphere snow cover. Observed changes in (a) global average surface temperature; (b) global average sea level from tide gauge (blue) and satellite (red) data and (c) Northern Hemisphere snow cover for March-April. All differences are relative to corresponding averages for the period 1961-1990. Smoothed curves represent decadal averaged values while circles show yearly values. The shaded areas are the uncertainty intervals estimated from a comprehensive analysis of known uncertainties (a and b) and from the time series (c). (Source: IPCC)
Originally uploaded in CAMEL.
Image 62113 is a 815 by 700 pixel WebP
Uploaded:
Aug5 15