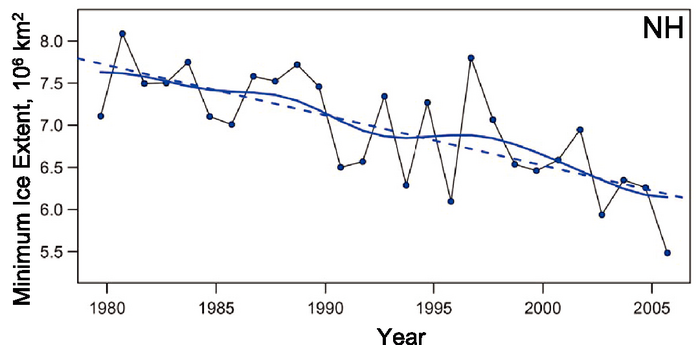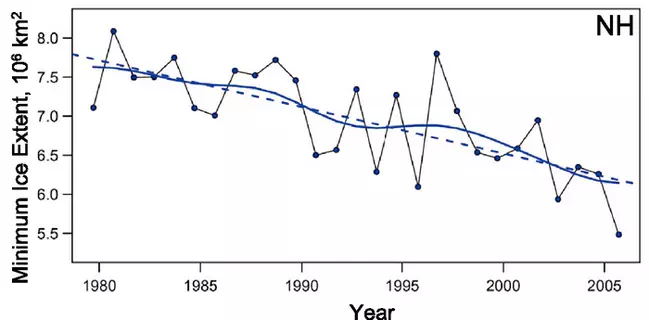
View Original Image at Full SizeFigure 2. Summer minimum arctic sea ice extent from 1979 to 2005. Symbols indicate annual mean values while the smooth blue curve shows decadal variations. The dashed line indicates the linear trend, which is –60 ± 20 × 103 km2 yr–1, or approximately –7.4% per decade. (Source: updated from Comiso, 2002)
Originally uploaded in CAMEL.
Image 62119 is a 345 by 700 pixel WebP
Uploaded:
Aug5 15
Last Modified: 2015-08-05 13:10:07
Permanent URL: https://serc.carleton.edu/download/images/62119/figure_2_climate_change.webp
The file is referred to in 1 page
- Climate Change
https://camelclimatechange.org/camel/climate_change.html
Provenance
Ginny Brown, National Council for Science and the Environment
ReuseThis item is offered under a Creative Commons Attribution-NonCommercial-ShareAlike license
http://creativecommons.org/licenses/by-nc-sa/3.0/ You may reuse this item for non-commercial purposes as long as you provide attribution and offer any derivative works under a similar license.