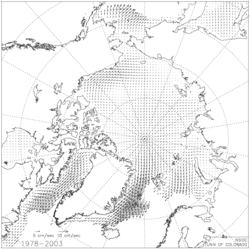
Plot showing mean (average) Arctic ice motion from 1978 to 2003. Arrows show the direction and velocity of the ice, with longer arrows representing higher velocities. Image courtesy of the National Snow and Ice Data Center, University of Colorado, Boulder, CO. (Source: NSIDC)
Originally uploaded in CAMEL.
Image 62681 is a 250 by 250 pixel WebP
Uploaded:
Aug6 15
Last Modified: 2015-08-06 14:29:16
Permanent URL: https://serc.carleton.edu/download/images/62681/sea_ice_source_nsidc_1438889356.webp
The file is referred to in 1 page
- Sea Ice
https://camelclimatechange.org/camel/sea_ice.html
Provenance
Ginny Brown, National Council for Science and the Environment
ReuseThis item is offered under a Creative Commons Attribution-NonCommercial-ShareAlike license
http://creativecommons.org/licenses/by-nc-sa/3.0/ You may reuse this item for non-commercial purposes as long as you provide attribution and offer any derivative works under a similar license.
