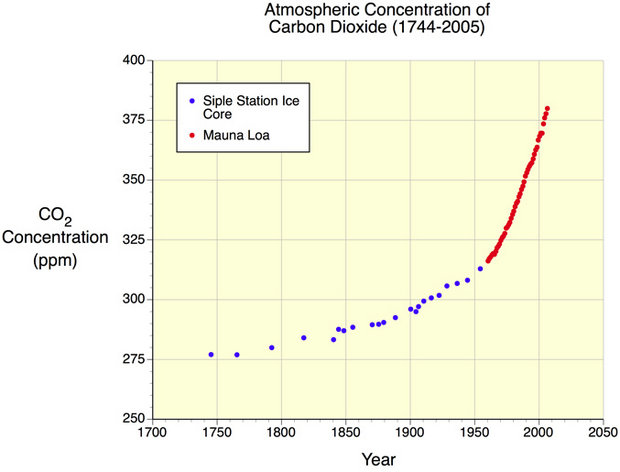
Figure 1: The following graph illustrates the rise in atmospheric carbon dioxide from 1744 to 2005. Note that the increase in carbon dioxide's concentration in the atmosphere has been exponential during the period examined. An extrapolation into the immediate future would suggest continued increases. (Source: PhysicalGeography.net)
Originally uploaded in CAMEL.
Image 63049 is a 472 by 620 pixel WebP
Uploaded:
Aug10 15
Last Modified: 2015-08-10 11:47:27
Permanent URL: https://serc.carleton.edu/download/images/63049/carbon_dioxide_1439225246.webp
The file is referred to in 1 page
- Carbon Dioxide
https://camelclimatechange.org/camel/carbon_dioxide.html
Provenance
Ginny Brown, National Council for Science and the Environment
ReuseThis item is offered under a Creative Commons Attribution-NonCommercial-ShareAlike license
http://creativecommons.org/licenses/by-nc-sa/3.0/ You may reuse this item for non-commercial purposes as long as you provide attribution and offer any derivative works under a similar license.
