
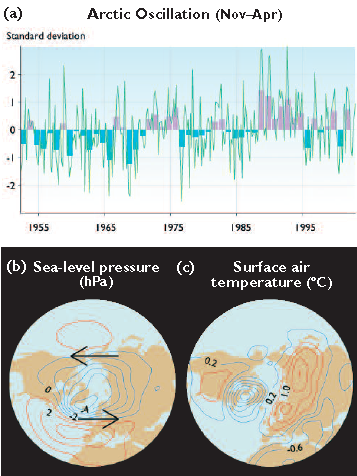
Fig. 2.2. Arctic Oscillation (a) time series based on anomalies of November to April monthly mean sea-level pressure, calculated relative to the 1952–2003 monthly mean (shading indicates November–April averages for each winter in the time series); and associated patterns of (b) sea-level pressure anomalies (1 hPa contours; arrows represent the anomalous wind direction) and (c) surface air temperature anomalies (0.4 ºC contours) derived from a principal components analysis of the time series[2]
Originally uploaded in CAMEL.
Image 63058 is a 476 by 357 pixel WebP
Uploaded:
Aug10 15