
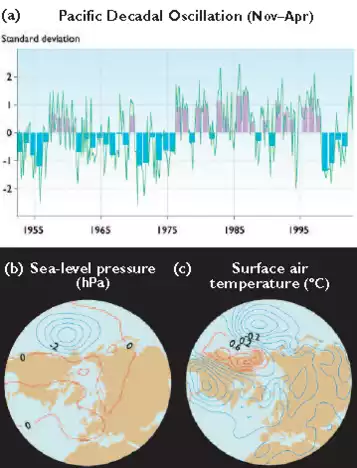
Fig. 2.3. Pacific Decadal Oscillation (a) time series based on anomalies of November to April monthly mean surface air temperature in the North Pacific, calculated relative to the 1952–2003 monthly mean (shading indicates November–April averages for each winter in the time series); and associated patterns of (b) sea-level pressure anomalies (1.0 hPa contours) and (c) surface air temperature anomalies (0.2 ºC contours) derived from a principal components analysis of the time series[3].
Originally uploaded in CAMEL.
Image 63061 is a 468 by 357 pixel WebP
Uploaded:
Aug10 15